Cost-sensitivity of the ML entry signal — defi_top5 (2026-06-09, exploratory)
Canonical experiment-report template (ADR-0097). This report is exploratory and underpowered, not confirmatory. The run was executed to validate a persistence fix (CVN-N001-EI-S13); the cost-sensitivity question was analysed after the data existed. Per ADR-0097 Invariant 1 it is labelled exploratory throughout. The contribution is a working cost-sensitivity diagnostic substrate plus a first pilot read — not a tradability verdict. Every interval here that contains zero is reported as uninformative, not as evidence of no effect (absence of evidence ≠ evidence of absence).
Version 0.3 — referee round 2 incorporated. See the Revision journal (end of document) for what changed and why. This banner and the journal are the canonical version marker for this report.
Abstract¶
Background. A supervised model emits BUY/HOLD entry signals on crypto pairs. The diagnostic program asks whether the resulting signal carries a tradable economic edge once realistic execution frictions are charged.
Objective. Establish and exercise a diagnostic that measures how out-of-sample (OOS) economic performance responds to transaction cost, and report a first pilot read on five DeFi USDC pairs.
Methods. One ablation run sweeps the per-leg exchange fee CVN_TRADE_FEE_BPS ∈ {10, 15, 20,
30} bps at a fixed base slippage of 5 bps/leg; the engine charges a round-trip cost
2 × (fee + slippage), i.e. realized round-trip ≈ {30, 40, 50, 70} bps. Five assets × three
walk-forward folds = 15 OOS units, each backtested at the four costs on an identical trade set
(cost applied post-hoc → clean cost isolation). Profit factor is reported pooled (Σgains/Σlosses)
and as a distribution, never as a mean of ratios. Uncertainty is a cluster (block) bootstrap that
resamples whole assets (and, separately, whole folds) to respect cross-sectional and temporal
dependence; with only 3–5 clusters these are reported as dependence-respecting indicative
ranges, not calibrated 95 % intervals ([CameronMiller2015] warns cluster-robust inference needs
≳ 30–50 clusters). Proportion intervals (Jeffreys) and the per-unit distributions remain calibrated
and carry the inferential weight, alongside the cost- and bootstrap-independent observations below.
Results. Central economic estimates degrade monotonically with cost; the pooled profit factor declines 1.49 → 1.23 → 1.01 → 0.66 and crosses below 1.0 between 50 and 70 bps realized round-trip (it is still 1.01 at 50 bps), while the mean net return turns negative in the same band. However the study is underpowered: at every cost the dependence-respecting indicative range for both net return and Sortino spans zero and a materially positive value (e.g. at 30 bps realized: net-return asset-cluster range [−7.5 %, +11.3 %], fold-cluster [−7.2 %, +19.3 %]) — even an uncalibrated, generously-wide range straddles zero, so the data neither establish nor exclude an edge. The one cost- and bootstrap-independent observation is that the central annualized Sortino (MAR = 0, 365-day basis — the same basis as the ~1.0 floor) never exceeds 0.56 (even excluding the worst asset, at the lowest cost), well below that floor; the per-unit Sortino does disperse up to +1.85, so this is a statement about the centre, not a claim that no unit clears the floor. Performance is dominated by cross-asset dispersion: one pair (Asset A) returns ≈ −22 % (Sortino −0.86, win rate 16 %), while four others sit near +5 to +7 % at 50 bps — five per-asset anecdotes, not a coherent portfolio edge.
Conclusion. The diagnostic substrate works end-to-end. The pilot is inconclusive on tradability (underpowered) but yields one robust caution — risk-adjusted performance is structurally below a deployable floor — and one structural finding — the apparent low-cost positivity is dispersion, not signal. No LOCK/ABANDON verdict is licensed; a pre-registered, higher-power confirmatory run is the next gate.
1. Introduction¶
A trading model is useful only if its signal nets a positive edge after execution frictions. A backtest that looks profitable at low cost can be an artefact of transaction-cost optimism: an edge that survives only below realistic costs is not deployable. This work (i) stands up a cost-sensitivity diagnostic — sweep cost, hold everything else fixed, measure OOS economics with dependence-aware intervals — and (ii) reports a first, deliberately-scoped pilot on the program's control universe.
It does not assess the model's classification quality (precision/recall/F1 of the BUY class): those metrics are unavailable on this execution path (§8) and are a separate training-path diagnostic. The pilot is small by design (5 assets, 3 folds); its purpose is to validate the measurement chain and generate hypotheses, not to deliver a verdict.
2. Background and Related Work¶
Walk-forward / time-series CV avoids look-ahead by training on a past window and testing on a strictly subsequent OOS window [Bergmeir2012]. The central risk being probed is backtest overfitting under transaction-cost optimism [Bailey2014, LopezdePrado2018]. We report effect sizes with confidence intervals rather than bare significance [Wasserstein2016], and — because the 15 units are neither numerous nor independent — use a cluster/block bootstrap [Efron1993, CameronMiller2015] that resamples whole assets or whole folds rather than individual rows. Proportions use the Jeffreys interval [BrownCaiDasGupta2001]. The minimal benchmark is HOLD (do nothing); the market benchmark is buy-and-hold.
3. Hypotheses and Pre-Registration¶
This report is NOT pre-registered (ADR-0097 Invariant 1). The run
ftf_20260608_233608_b6cc67 was triggered to validate a data-persistence fix (CVN-N001-EI-S13); the
cost-sensitivity analysis was specified after the rows existed. Everything below is exploratory
and hypothesis-generating.
The (post-hoc) frame, stated for transparency and to be pre-registered before any confirmatory re-run:
- H1 (edge). At a given cost, the cross-section mean OOS net return and Sortino are > 0.
- H2 (survival). A positive edge persists into the realistic-cost band.
- Tradability rule (to apply only under pre-registration, NOT here). A "tradable" claim requires, at a realistic round-trip cost, a mean annualized Sortino whose dependence-respecting, calibrated 95 % CI (wild cluster bootstrap or ≳ 30 clusters — not the small-cluster bootstrap used descriptively here) excludes zero and a central Sortino above a deployable floor (≈ 1.0), on the confirmatory universe.
We deliberately drop the earlier "model − HOLD" hypothesis: since HOLD ≡ 0 net return by construction, that delta is identical to H1 and is not an independent test. The economically meaningful benchmark is buy-and-hold (the market), reported in §6.2.
Multiplicity. No confirmatory claim is made; the four costs are descriptive points on a sensitivity curve, not four independent tests. Statements of the form "the CI contains zero at every cost" are descriptive of the curve, not a family of rejections.
Symmetric reading (load-bearing). Where a CI contains zero it also contains large positive values; the correct statement is "uninformative / underpowered", never "no effect". This caveat governs the Abstract, §7, and §9.
4. Data and Experimental Setup¶
| Item | Value |
|---|---|
| Universe | five DeFi USDC pairs, anonymised Asset A–E (program control group defi_top5) |
| Strategy / labelling | ATR0.5_1.5_H4 (ATR-scaled barriers; horizon 4) |
| Model family | Gradient-boosted trees (XGBoost), HPO per fold |
| Folds | 3 walk-forward folds, 9-month train / 2-month OOS test, non-overlapping tests; the most recent window (a holdout fold) is excluded from this run |
| Fold 4 | train 2025-01-01 → 2025-10-01, test 2025-10-01 → 2025-12-01 |
| Fold 3 | train 2025-03-01 → 2025-12-01, test 2025-12-01 → 2026-02-01 |
| Fold 2 | train 2025-05-01 → 2026-02-01, test 2026-02-01 → 2026-04-01 |
| Swept variable | per-leg exchange fee CVN_TRADE_FEE_BPS ∈ {10, 15, 20, 30} bps |
| Fixed slippage | slippage_base_bps = 5 per leg (config default; market-impact term 0.001·√(size/vol) additionally applies on the model path) |
| Realized round-trip cost | 2 × (fee + slippage) ⇒ ≈ {30, 40, 50, 70} bps for fee {10, 15, 20, 30}. Tables/figures use realized round-trip on the x-axis. |
| Units of analysis | 5 assets × 3 folds = 15 per cost (60 model rows) |
| Cost application | post-hoc on an identical trade set per asset-fold (n_trades ≈ 23 invariant to cost) → cost effect mechanically isolated; the policy is cost-unaware (worst case — see §8) |
| Benchmarks | naive (HOLD, 0 trades), buy_and_hold, random, cost-matched |
| Run id | ftf_20260608_233608_b6cc67_ATR0.5_1.5_H4 |
| Code / image | champollion 1cba660c (persist-parity fix CVN-N001-EI-S13 live) |
Cost-mapping caveat (construct validity). The realized round-trip is model-defined, not
measured: slippage_base_bps = 5 is a configured default whose fidelity to actual microstructure for
these pairs/sizes is not verified here. Realistic crypto spot round-trips are commonly ~15–30 bps;
the lowest cost tested (30 bps realized) sits at the top of that band, so the interior of the
realistic band is not probed — read the curve as an upper-cost sensitivity, with the realistic-cost
region at or below the leftmost point.
Reproducibility caveat (time anchoring). The fold generator is now()-relative; windows are pinned
above (and §10) so this run is reproducible despite the relative anchoring.
5. Methods¶
For each cost c, the 15 asset-fold units yield metric vectors. We report:
- Central tendency — cross-unit mean and median (median primary; the mean is skew-sensitive, dominated by Asset A).
- Profit factor — pooled PF = Σ(gross gains) / Σ(gross losses) over units, reconstructed as
Σ n_wins·avg_win / Σ n_losses·|avg_loss|; and the distribution (median, IQR). We never report a mean of per-unit profit factors (a mean of ratios is not a profit factor and produces internally-contradictory aggregates). - Risk-adjusted metric (Sortino). Reported Sortino is the engine's persisted
sortino_ratio(src/backtest/cvntrade_backtest_metrics.py): annualized (vectorbtsortino_ratio, 365-day basis; manual fallback(mean_ret / downside_std)·√(periods/yr)), computed from per-candle equity returns, with MAR = 0 (no minimum-acceptable-return offset). The conventional ~1.0 tradability floor is itself an annualized figure, so the floor comparison is on the same basis (same periodicity, same MAR = 0) — no annualization rescaling is applied to either side. Engine clamp±20(_CAP_SORTINO) never binds here (§6.5). - Uncertainty (indicative ranges, NOT calibrated 95 % CIs) — cluster bootstrap, 10 000 resamples, seed 42, percentile method, resampling whole assets (5 clusters; primary, captures cross-sectional correlation) and, separately, whole folds (3 clusters; captures temporal overlap). With 3–5 clusters the percentile bootstrap has no valid 95 % coverage ([CameronMiller2015]: cluster-robust inference needs ≳ 30–50 clusters); we therefore label these outputs indicative ranges / sensitivity bands, not "95 % CIs", and lean the inference on the bootstrap-free statements (§6.4, dispersion) instead. A wild cluster bootstrap (Webb 6-point weights) is the calibrated refinement, deferred to the higher-power confirmatory re-run (§9). An i.i.d. row bootstrap is shown only to demonstrate it is anti-conservative. Estimand: the equal-weight cross-section mean OOS metric on this five-asset universe — a descriptive quantity for a small heterogeneous panel, not a "deployable portfolio edge"; with 3–5 clusters the ranges are necessarily wide, which is the honest information content.
- Proportions — beat-rate (units net-positive) with Jeffreys 95 % intervals (these are calibrated — a binomial proportion, not a small-cluster bootstrap).
- Robustness — all statistics recomputed excluding Asset A (12 units), to test whether conclusions are an artefact of one pathological pair.
- Integrity — per-row reconstructed PF reconciled against the stored profit factor; the Sortino clamp's bite checked; baseline clamp status documented (§6.5).
Returns are in percent (engine total_return); aggregation is unweighted across units.
6. Results¶
6.1 Cost-sensitivity curve (primary, n = 15 per cost)¶
| Realized RT cost (bps) | Net return mean % | median % | asset-cluster range | fold-cluster range | Sortino mean (ann.) | median | asset-cluster range | Pooled PF | PF median [IQR] | Net-positive units (Jeffreys 95 % CI) |
|---|---|---|---|---|---|---|---|---|---|---|
| 30 (fee 10) | +4.70 | +5.13 | [−7.5, +11.3] | [−7.2, +19.3] | 0.291 | 0.191 | [−0.25, +0.58] | 1.49 | 1.87 [0.13, 2.77] | 8/15 (53 %; [29 %, 76 %]) |
| 40 (fee 15) | +2.37 | +3.49 | [−9.2, +8.6] | [−8.8, +14.7] | 0.169 | 0.128 | [−0.33, +0.44] | 1.23 | 1.53 [0.06, 2.25] | 8/15 (53 %; [29 %, 76 %]) |
| 50 (fee 20) | +0.13 | +1.87 | [−11.0, +6.1] | [−10.3, +10.4] | 0.057 | 0.069 | [−0.40, +0.32] | 1.01 | 1.26 [0.02, 1.82] | 8/15 (53 %; [29 %, 76 %]) |
| 70 (fee 30) | −4.07 | −1.43 | [−14.3, +1.8] | [−13.2, +2.3] | −0.134 | −0.038 | [−0.54, +0.11] | 0.66 | 0.78 [0.00, 1.15] | 4/15 (27 %; [10 %, 52 %]) |
Reading. (i) Central estimates degrade monotonically (mechanical cost haircut on a fixed trade set); pooled PF crosses below 1.0 between 50 and 70 bps realized (still 1.01 at 50), and mean net return turns negative in the same band. (ii) The study is underpowered: every indicative range for return and Sortino spans zero and a sizeable positive value — e.g. at 30 bps the asset-cluster return range is [−7.5, +11.3] % and the fold-cluster range reaches +19.3 %. (iii) The fold-cluster ranges (3 clusters) are wider than the i.i.d. row bootstrap, confirming the latter is anti-conservative; respecting dependence widens, not narrows, the spread. (iv) The net-positive rate is a coin flip (53 %, Jeffreys 95 % CI [29 %, 76 %]) until 70 bps. The cluster ranges are not calibrated 95 % intervals (3–5 clusters; §5) — read them as "even a generously-wide, uncalibrated band still straddles zero", not as exact bounds.
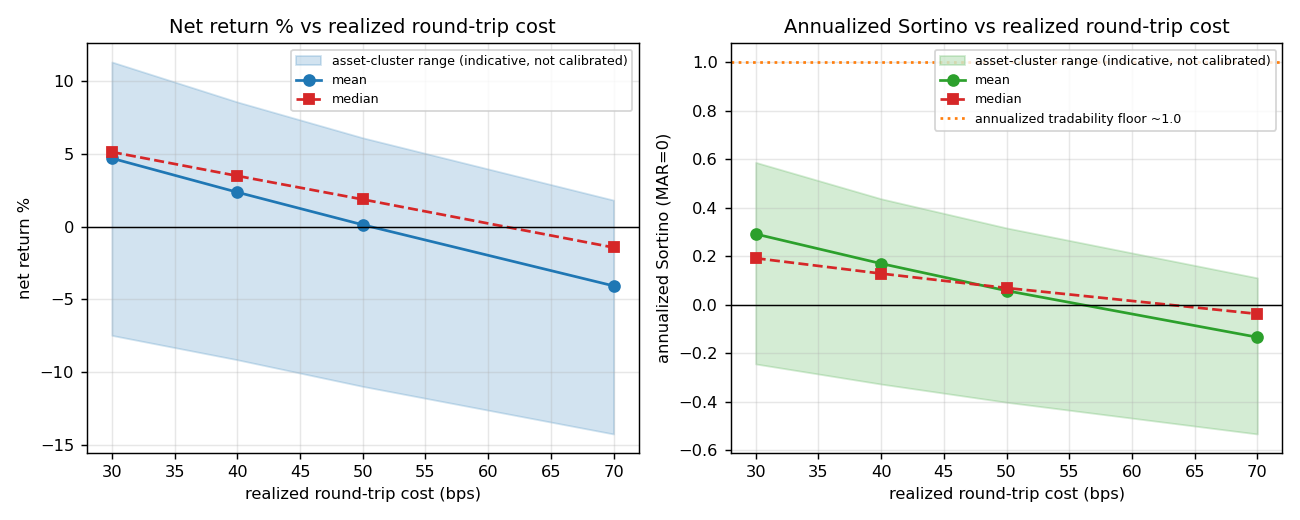 Figure 1. Mean (solid) and median (dashed) net return and annualized Sortino vs realized
round-trip cost, with asset-cluster indicative-range bands (shaded; not calibrated 95 % CIs —
§5). The dotted line marks the ~1.0 Sortino floor, plotted on the same annualized, MAR = 0 basis as
the curve (§5, R1). The Sortino central estimate is far below the floor at every cost; the band reaches
above it only via dispersion, never the centre.
Figure 1. Mean (solid) and median (dashed) net return and annualized Sortino vs realized
round-trip cost, with asset-cluster indicative-range bands (shaded; not calibrated 95 % CIs —
§5). The dotted line marks the ~1.0 Sortino floor, plotted on the same annualized, MAR = 0 basis as
the curve (§5, R1). The Sortino central estimate is far below the floor at every cost; the band reaches
above it only via dispersion, never the centre.
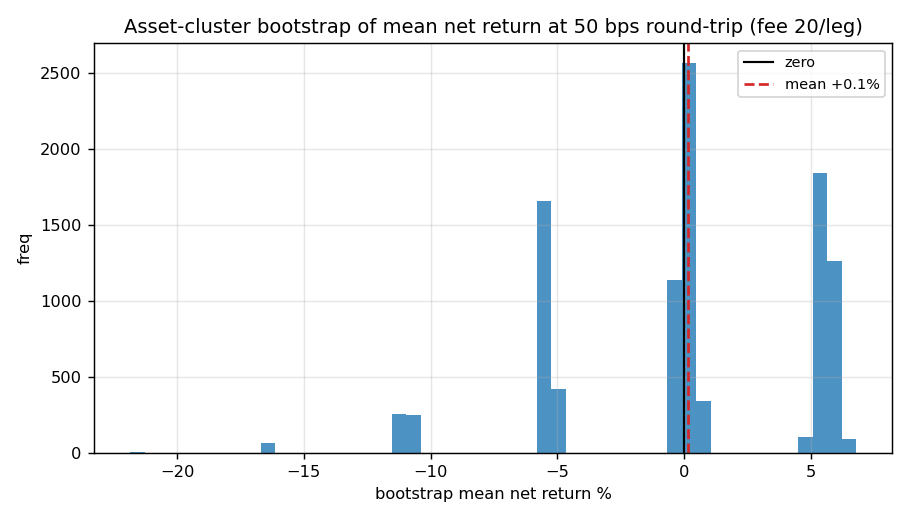 Figure 4. Asset-cluster bootstrap distribution of the mean net return at 50 bps realized (fee 20/leg):
the mass straddles zero with wide spread — a direct picture of the underpowered estimate.
Figure 4. Asset-cluster bootstrap distribution of the mean net return at 50 bps realized (fee 20/leg):
the mass straddles zero with wide spread — a direct picture of the underpowered estimate.
6.2 Benchmark comparison¶
HOLD (naive) = 0 return by construction; the model − HOLD delta is therefore identical to H1 (§3) and
is not reported as a separate test. Against the market (buy_and_hold, cost-matched), buy-and-hold
returned ≈ −0.33 % across these windows (roughly flat-to-down), with Sortino ≈ −0.53 — so at low cost
the model's central return exceeds buy-and-hold, but the difference is well inside the indicative ranges
of §6.1 and is not established. The random baseline is catastrophic (≈ 540 trades bled by cost) with a
deeply negative Sortino — large enough that its downside-deviation denominator is near-degenerate, so
the precise magnitude is not meaningful (see §6.5); clearing it is a trivially low bar, not evidence of
edge.
Cost asymmetry caveat (R3). The realized round-trip {30, 40, 50, 70} bps counts 2·(fee + slippage)
only. The model path additionally charges a market-impact term 0.001·√(size/vol) that the
buy_and_hold and random baselines do not pay, so (i) the model-vs-benchmark comparison is
conservative for the model (it carries a cost the benchmarks escape), and (ii) the model's effective
round-trip cost is slightly above the x-axis label — the displayed cost is a lower bound on what the
model actually paid. Neither effect helps the model's case, so the negative read is if anything understated.
6.3 Cross-asset dispersion at a fixed cost (50 bps realized; mean over 3 folds)¶
(Reported at a fixed cost — we do not average over cost, the studied variable.)
| Asset | Sortino | Win rate % | n_trades | Net return % |
|---|---|---|---|---|
| A | −0.860 | 15.5 | 28 | −21.85 |
| B | +0.247 | 49.4 | 28 | +5.08 |
| C | +0.340 | 26.3 | 18 | +6.79 |
| D | +0.321 | 66.5 | 17 | +5.01 |
| E | +0.239 | 75.9 | 26 | +5.61 |
Win rates span 15.5 %–75.9 % with no stable pattern (Asset C is net-positive on a 26 % win rate — barrier asymmetry, not consistency). One asset (A) is pathological; the apparent portfolio positivity is carried by the other four. With five assets, one pair pivots the aggregate in either direction → this is five per-asset anecdotes, not a portfolio result. The full asset × cost matrix:
| Asset \ realized RT (bps) | 30 | 40 | 50 | 70 |
|---|---|---|---|---|
| A | −19.19 | −20.54 | −21.85 | −24.34 |
| B | +11.41 | +8.14 | +5.08 | −0.47 |
| C | +11.28 | +8.98 | +6.79 | +2.72 |
| D | +8.76 | +6.86 | +5.01 | +1.43 |
| E | +11.24 | +8.38 | +5.61 | +0.30 |
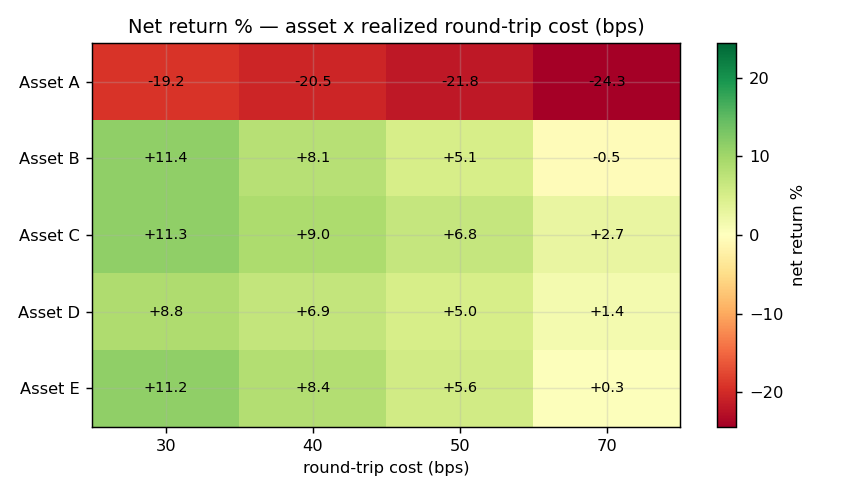 Figure 5. Net return by asset × realized round-trip cost. Asset A is uniformly red; B–E converge toward
zero by 70 bps. No coherent cross-asset pattern.
Figure 5. Net return by asset × realized round-trip cost. Asset A is uniformly red; B–E converge toward
zero by 70 bps. No coherent cross-asset pattern.
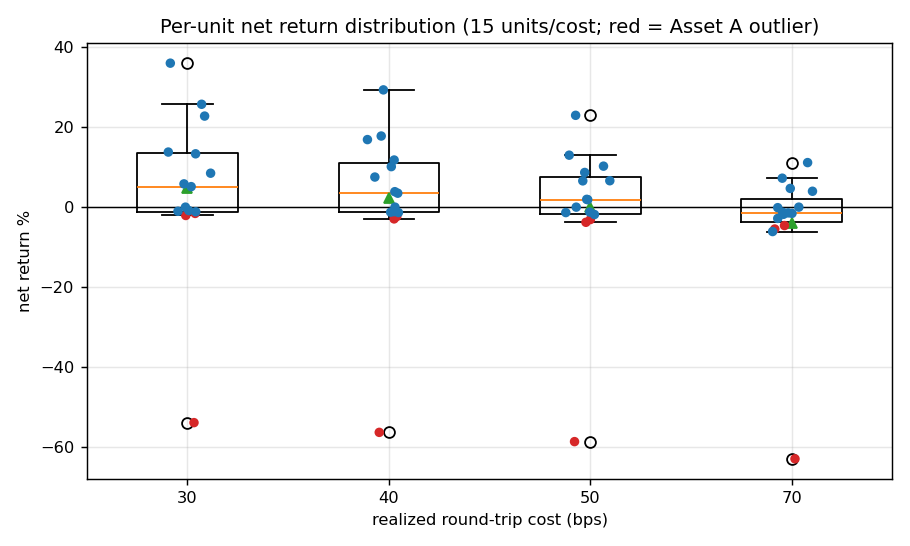 Figure 3. Per-unit net-return distribution at each cost (box = quartiles, 15 points; red = Asset A).
The mean is pulled by the outlier; the spread dwarfs the central tendency.
Figure 3. Per-unit net-return distribution at each cost (box = quartiles, 15 points; red = Asset A).
The mean is pulled by the outlier; the spread dwarfs the central tendency.
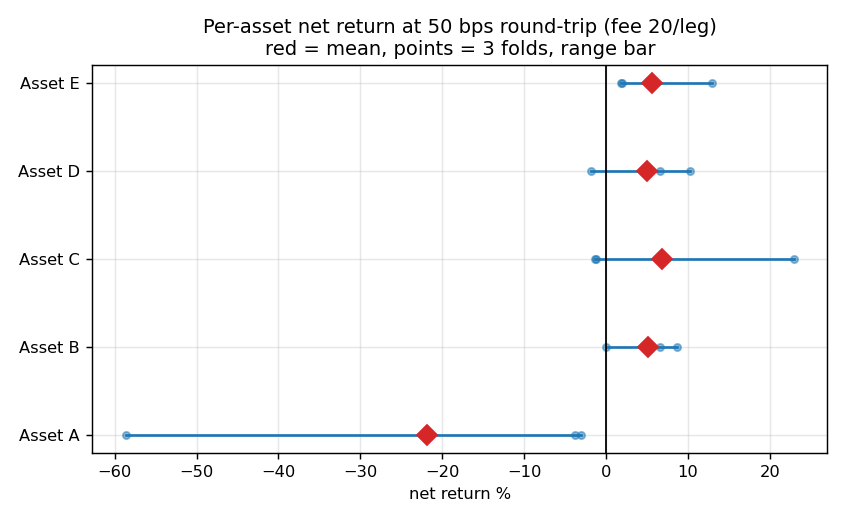 Figure 6. Per-asset net return at 50 bps realized (diamond = mean, points = 3 folds, bar = range) vs
zero. The canonical picture of heterogeneous effects with no consistent sign — the strongest visual for
"dispersion, not edge".
Figure 6. Per-asset net return at 50 bps realized (diamond = mean, points = 3 folds, bar = range) vs
zero. The canonical picture of heterogeneous effects with no consistent sign — the strongest visual for
"dispersion, not edge".
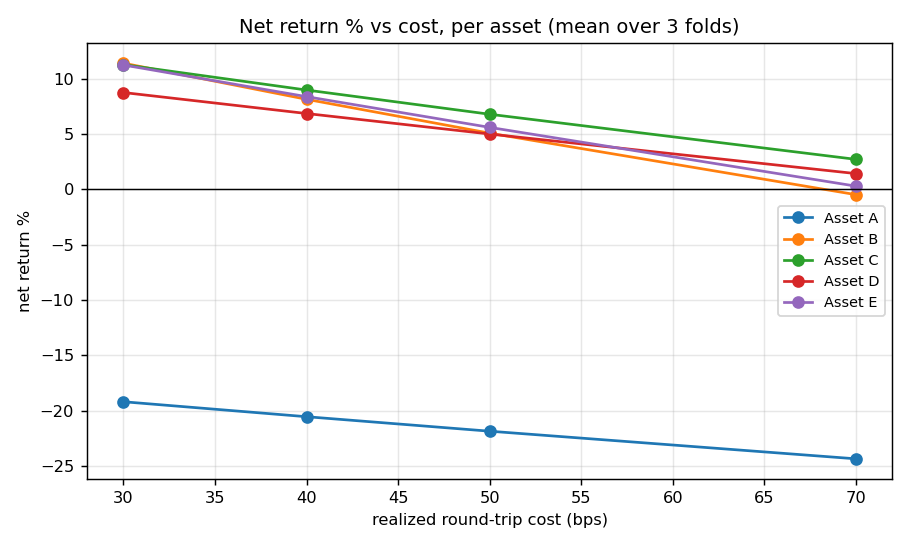 Figure 2. Net return vs cost per asset. Four lines decline toward zero by 70 bps; Asset A sits far below
throughout.
Figure 2. Net return vs cost per asset. Four lines decline toward zero by 70 bps; Asset A sits far below
throughout.
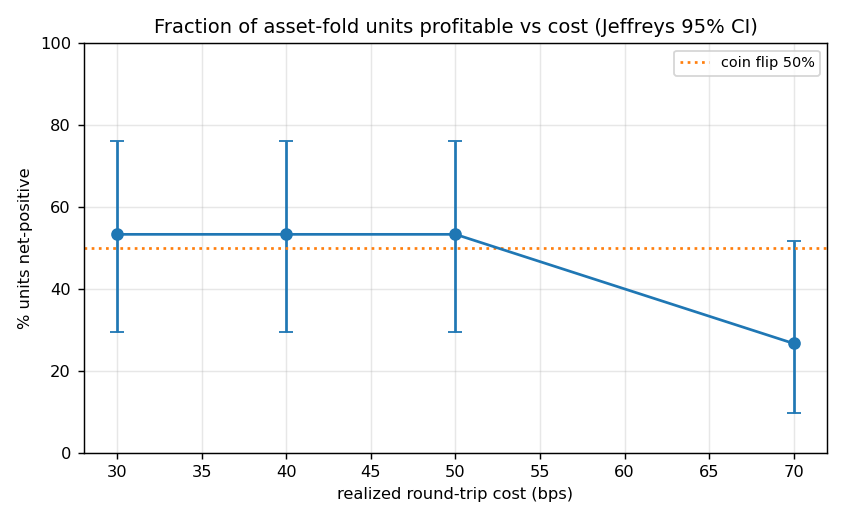 Figure 7. Fraction of units net-positive vs cost with Jeffreys 95 % CI; the rate is statistically
indistinguishable from a coin flip until 70 bps.
Figure 7. Fraction of units net-positive vs cost with Jeffreys 95 % CI; the rate is statistically
indistinguishable from a coin flip until 70 bps.
6.4 Robustness — excluding Asset A (n = 12)¶
| Realized RT (bps) | Sortino mean | median | Net return mean % | median % |
|---|---|---|---|---|
| 30 | 0.558 | 0.297 | +10.67 | +7.16 |
| 40 | 0.417 | 0.229 | +8.09 | +5.70 |
| 50 | 0.287 | 0.166 | +5.62 | +4.26 |
| 70 | 0.063 | −0.016 | +0.99 | −0.71 |
Excluding the worst asset (a post-hoc, non-legitimate filter) lifts the central estimate to positive through 50 bps — confirming the aggregate conclusion is outlier-sensitive in both directions. Yet even here the central annualized Sortino never exceeds ≈ 0.56 (same 365-day, MAR = 0 basis as the floor; R1) and crosses zero by 70 bps. This is the report's most robust statement: regardless of bootstrap or outlier handling, the central risk-adjusted performance sits well below a ~1.0 deployable floor.
Symmetric caveat (R5). This is a statement about the centre, not a claim that every unit is sub-floor. The per-unit Sortino disperses across [−2.42, +1.85] (§6.5): a minority of asset-folds do clear 1.0 in isolation. The same dispersion that forbids a positive portfolio claim also forbids a blanket "all units sub-floor" claim — the defensible reading is that the cross-section centre is structurally below the floor at every cost.
6.5 Metrics-integrity check¶
- Profit-factor self-consistency. Per-row reconstructed PF (
n_wins·avg_win / n_losses·|avg_loss|) matches the storedprofit_factorwithin 10 % on 56/56 eligible rows →avg_winning_trade,avg_losing_trade, andprofit_factorare mutually consistent (the pooled PF in §6.1 rests on validated inputs). - Sortino definition + clamp. Reported Sortino is the engine's annualized
sortino_ratio(MAR = 0, 365-day basis, from per-candle equity returns — §5, R1), directly comparable to the annualized ~1.0 floor. The runner clamps model Sortino to ±20 (_CAP_SORTINO); observed model Sortino lies in [−2.42, +1.85], so the clamp never binds — the reported means are uncensored. Baselines are not clamped, so therandomSortino is a genuine value, not a clamp artefact — but its magnitude (order −10¹ to −10²) is not numerically meaningful: arandompolicy with near-zero mean return and a tiny, ill-conditioned downside-deviation denominator produces an unstable ratio. We read it only as "deeply negative → a trivial floor cleared", never as a calibrated number. - Unavailable metric.
max_drawdownis0.0000on all rows — not a true zero but a runtime metric-extraction gap (§8); no drawdown-dependent statistic (e.g. Calmar) is cited.
7. Discussion¶
The pilot supports three statements, at different confidence levels:
- Underpowered on the edge question (low confidence either way). At every cost, the dependence-respecting indicative range (not a calibrated 95 % CI — only 3–5 clusters, §5) for return and Sortino spans both a loss and a sizeable gain. The data are compatible with a meaningful low-cost edge and with none. This is absence of evidence, not evidence of absence — the study cannot establish or exclude tradability.
- Central risk-adjusted performance below floor (higher confidence, bootstrap-independent). The central annualized Sortino (MAR = 0, same 365-day basis as the floor — R1) never exceeds ~0.56, across all costs, with or without the outlier, versus a ~1.0 deployable floor. This descriptive fact does not depend on the fragile small-cluster bootstrap and is the most defensible negative signal. It is a statement about the cross-section centre: the per-unit Sortino does disperse up to +1.85 (§6.5), so a minority of units clear the floor in isolation — the centre, not every unit, sits below.
- Dispersion, not signal (structural). The aggregate is one disaster plus four modestly-positive anecdotes; pooled PF falls below 1.0 by 50 bps; win rates are incoherent (16 %–76 %). Five assets cannot support a portfolio claim, and the cross-section shows no consistent edge.
What the result does not license: it does not prove the underlying classifier is worthless — classification quality is not measured here (§8); a serviceable classifier can still be untradable after cost and execution, which is exactly the gap this diagnostic isolates. Nor does it license any portfolio verdict from 15 dependent units on one universe.
The corrected cost axis matters: because the swept number is the per-leg fee and slippage adds a fixed 10 bps round-trip, the realistic-cost region (~15–30 bps round-trip) lies at or below the lowest tested point (30 bps), so the economically-relevant regime is the least-costed, most-favourable — and even there the edge is not established and Sortino is sub-floor.
8. Threats to Validity / Limitations¶
- No pre-registration (conclusion validity). Decision frame set after seeing data (§3) → all inference exploratory. Mitigation: pre-register H1–H2 + the tradability rule and re-run.
- Underpowered; small dependent sample (statistical + external validity). 15 units, 3–5 clusters, one universe, 3 OOS windows (2025-10 → 2026-04). Wide CIs are intrinsic; cluster intervals are coarse. Mitigation: expand assets/folds; treat all intervals as indicative; prefer the bootstrap-free §6.4 statement.
- Outlier leverage (statistical validity). Asset A pivots the mean; medians, the ex-A cut, and per-asset figures bound this. No aggregate verdict is drawn.
- Cost is model-defined, not measured (construct validity). Realized round-trip =
2·(fee+5); the 5 bps base slippage is a config default of unverified fidelity, and the realistic band's interior (<30 bps round-trip) is not probed. Mitigation: calibrate fees+slippage to measured microstructure; extend the sweep below 30 bps round-trip. - Cost-unaware policy (construct validity). Cost is applied post-hoc to a fixed trade set
(n_trades invariant); a cost-aware policy (the funnel has a
cost_block_ratefilter) would skip marginal trades at high cost, flattening the curve. The reported curve is a worst-case upper bound on cost sensitivity for a non-adaptive policy. - In-sample HPO per fold (internal validity). Hyperparameters tuned per fold; even with OOS tests, selection can inflate apparent low-cost performance. Mitigation: nested/held-out HPO.
- Classification metrics absent (construct validity).
f1_buy,precision_buy,recall_buyare NULL on the backtest path; this report measures economic tradability only. Follow-up: read F1 from the training-path factors. max_drawdown = 0runtime gap (construct validity / data defect). A missing metric, not a true zero; drawdown-based statistics omitted. Follow-up: file the extraction gap.- Small-cluster bootstrap has no valid 95 % coverage (statistical validity). With 3–5 clusters the percentile cluster bootstrap is not a calibrated 95 % interval ([CameronMiller2015]); resampling 3 folds or 5 assets yields very few distinct configurations, so the reported bands are indicative ranges, not bounds (relabelled throughout — §5). Percentile intervals additionally under-cover for skewed small samples; BCa or median/trimmed-mean intervals are a refinement. Mitigation: a wild cluster bootstrap (Webb 6-point weights) at the higher-power re-run, stating coverage is still not guaranteed below ~5 clusters. The qualitative conclusion (an even generously-wide range straddles zero) is robust to all of this, and the load-bearing claims are bootstrap-free (§6.4, dispersion).
9. Conclusion and Next Steps¶
The cost-sensitivity diagnostic substrate is validated end-to-end. The pilot is inconclusive on tradability — underpowered, with intervals compatible with both a loss and a gain at every cost — but delivers one robust, bootstrap-free caution (risk-adjusted performance is structurally below a ~1.0 deployable floor) and one structural finding (the apparent low-cost positivity is cross-asset dispersion, not a coherent edge). No LOCK/ABANDON verdict is licensed from this run.
Ordered next steps, each with its gate:
1. Pre-register H1–H2 + the tradability rule (link + timestamp) — gate for any confirmatory claim.
2. Re-run at higher power: more assets and folds (target ≳ 10–15 clusters), the sweep extended
below 30 bps round-trip, with measured fees+slippage; replace the indicative cluster ranges with
a wild cluster bootstrap (Webb 6-point weights) and BCa intervals — only then can a calibrated 95 %
statement be made.
3. Read F1/precision/recall from the training-path factors to separate "weak classifier" from "decent
classifier, untradable after cost".
4. File the runtime max_drawdown = 0 extraction gap.
5. Do not record a tradability verdict on this exploratory pilot.
10. Reproducibility Statement¶
- Run.
ftf_20260608_233608_b6cc67_ATR0.5_1.5_H4(cost_scenario, control universe, power_mode standard). 60 rows infinetune_results; 180 infinetune_baselines(cost-keyed). - Code. Image / commit champollion
1cba660c(CVN-N001-EI-S13). Pathssrc/commun/finetune/{ablation_runner,persistence,baselines}.py,src/commun/config/cost_model.py. - Cost model. Round-trip
= 2·(fee_bps + slippage_base_bps),slippage_base_bps = 5; sweptCVN_TRADE_FEE_BPS ∈ {10,15,20,30}⇒ realized ≈ {30,40,50,70} bps. - Data windows. Calendar, not indices — fold 4 test 2025-10-01→2025-12-01, fold 3 test 2025-12-01→2026-02-01, fold 2 test 2026-02-01→2026-04-01 (9-month trains, §4). Holdout fold excluded.
- Statistics. Cross-unit mean/median; pooled PF; cluster (asset & fold) percentile bootstrap, 10 000 resamples, seed 42 — reported as indicative ranges, not calibrated 95 % CIs at 3–5 clusters (§5); annualized Sortino (MAR = 0, 365-day basis); Jeffreys proportion CIs (calibrated); no multiplicity correction (no confirmatory claim).
- Environment. In-cluster query (Airflow scheduler pod) against the FTF PostgreSQL; analysis + figures Python 3.12, numpy, scipy 1.16, matplotlib 3.10. Analysis script archived (Appendix A).
Glossary¶
- bps (basis point) — 1/100th of a percent.
- per-leg fee vs realized round-trip cost — the swept
CVN_TRADE_FEE_BPSis charged per leg; the realized cost of opening+closing a position is2·(fee + slippage). This report's x-axis is the realized round-trip. - Sortino ratio — return per unit of downside deviation. As persisted by the engine
(
cvntrade_backtest_metrics.pysortino_ratio): computed from per-candle equity-curve returns, minimum-acceptable-return (MAR) = 0, and annualized to a 365-day basis (vectorbtsortino_ratio, frequency inferred from the per-candle index; the manual fallback applies the explicit factor√(periods_per_year),periods_per_year = 365·24·60 / timeframe_minutes). The conventional tradability floor ≈ 1.0 is also an annualized figure, so floor comparisons in this report are like-for-like (same periodicity, same MAR = 0); no rescaling is applied to either side. - Pooled profit factor — Σ gross gains ÷ Σ gross losses over units (unitless). Distinct from — and not to be confused with — the mean of per-unit profit factors, which is not a profit factor.
- Net total return — backtest return after the charged transaction cost, in percent.
- HOLD /
naive— do-nothing benchmark (0 trades, 0 return). buy-and-hold — the market benchmark. - Walk-forward fold — a train window followed by a strictly later OOS test window.
- Cluster (block) bootstrap — resamples whole clusters (here assets, or folds) with replacement to respect dependence; intervals are wider than an i.i.d. bootstrap and honest about correlated units. Caveat: with only 3–5 clusters it has no valid 95 % coverage ([CameronMiller2015] indicates ≳ 30–50 clusters); this report therefore calls its cluster outputs indicative ranges, not 95 % CIs.
- Wild cluster bootstrap — a cluster bootstrap variant (e.g. Webb 6-point weights) with better small-cluster behaviour; the planned refinement for the confirmatory re-run (still not guaranteed below ~5 clusters).
- Estimand — the quantity being estimated: here, the equal-weight cross-section mean OOS metric on this five-asset universe (descriptive, not a deployable-portfolio edge).
- Jeffreys interval — a Bayesian-derived proportion CI with good small-sample coverage.
- Asset A–E — anonymised labels for the five control-universe pairs.
References¶
- [Bailey2014] Bailey, Borwein, López de Prado, Zhu. "Pseudo-Mathematics and Financial Charlatanism." Notices of the AMS, 2014.
- [Bergmeir2012] Bergmeir, Benítez. "On the use of cross-validation for time series predictor evaluation." Information Sciences, 2012.
- [BrownCaiDasGupta2001] Brown, Cai, DasGupta. "Interval Estimation for a Binomial Proportion." Statistical Science, 2001.
- [CameronMiller2015] Cameron, Miller. "A Practitioner's Guide to Cluster-Robust Inference." Journal of Human Resources, 2015.
- [Efron1993] Efron, Tibshirani. An Introduction to the Bootstrap. Chapman & Hall, 1993.
- [LopezdePrado2018] López de Prado. Advances in Financial Machine Learning. Wiley, 2018.
- [Wasserstein2016] Wasserstein, Lazar. "The ASA Statement on p-Values." The American Statistician, 2016.
Appendix A — Full numerical results and analysis script¶
Analysis + figure script archived at
documentation/reports/_data/2026-06-09-cost-sensitivity-analysis.py, and the raw run dump it
consumes is archived alongside at documentation/reports/_data/2026-06-09-ftf_data.json (the script reads
the archived copy, falling back to its /tmp staging path). Together they reproduce end-to-end from raw
rows to every figure and statistic — pooled PF, cluster (indicative) ranges, Jeffreys CIs, integrity
checks (56/56), and the seven figures — under seed 42. Per-asset × cost net-return matrix in §6.3;
per-cost aggregates with ranges in §6.1.
Appendix B — Pre-registration snapshot¶
None. This run was not pre-registered (§3); it is exploratory. A pre-registration snapshot will accompany the confirmatory re-run (Next Step 1–2).
Revision journal¶
| Version | Date | Change |
|---|---|---|
| 0.1 | 2026-06-09 | Initial draft (post-S13 validation run ftf_20260608_233608_b6cc67). |
| 0.2 | 2026-06-09 | Referee round 1: pooled PF (not mean-of-ratios) + integrity 56/56; symmetric absence-of-evidence framing; cost axis corrected to fee/leg vs realized round-trip {30,40,50,70}; dispersion foregrounded; estimand defined; H3 dropped, buy-and-hold benchmark; assets anonymised A–E; per-asset at fixed cost. |
| 0.3 | 2026-06-09 | Referee round 2. R1 — Sortino definition pinned (annualized, MAR = 0, 365-day basis, per-candle equity returns) and shown same-basis as the ~1.0 floor → the flagship "central Sortino sub-floor" claim verified, not inverted (Glossary, §5, §6.4, §6.5, §7, Fig 1). R2 — small-cluster bootstrap relabelled from "95 % CI" to indicative range throughout ([CameronMiller2015]: no valid coverage at 3–5 clusters); Jeffreys proportion CIs kept as 95 %; wild cluster bootstrap (Webb) added as the deferred calibrated refinement (§5, §6.1, §8, §9, Fig 1). R3 — model-path market-impact cost asymmetry vs baselines noted (§6.2). R4 — random Sortino magnitude flagged as denominator-degenerate, not a calibrated number (§6.2, §6.5). R5 — symmetric per-unit Sortino range [−2.42, +1.85] added wherever "central sub-floor" is stated (§6.4, §7, Abstract). R7 — "pooled PF crosses 1.0 at ≈50 bps" → "crosses below 1.0 between 50 and 70 bps" (Abstract, §6.1). R8 — raw run dump archived next to the analysis script (_data/2026-06-09-ftf_data.json); script now reads the archived copy; figures regenerated with corrected labels (integrity 56/56 reproduced). |